Uptime monitoring

Know before
your clients do.

Monitor servers and HTTP endpoints around the clock. Get notified the moment something goes down, and view the full uptime history — all without leaving Bugdrive - Staging.
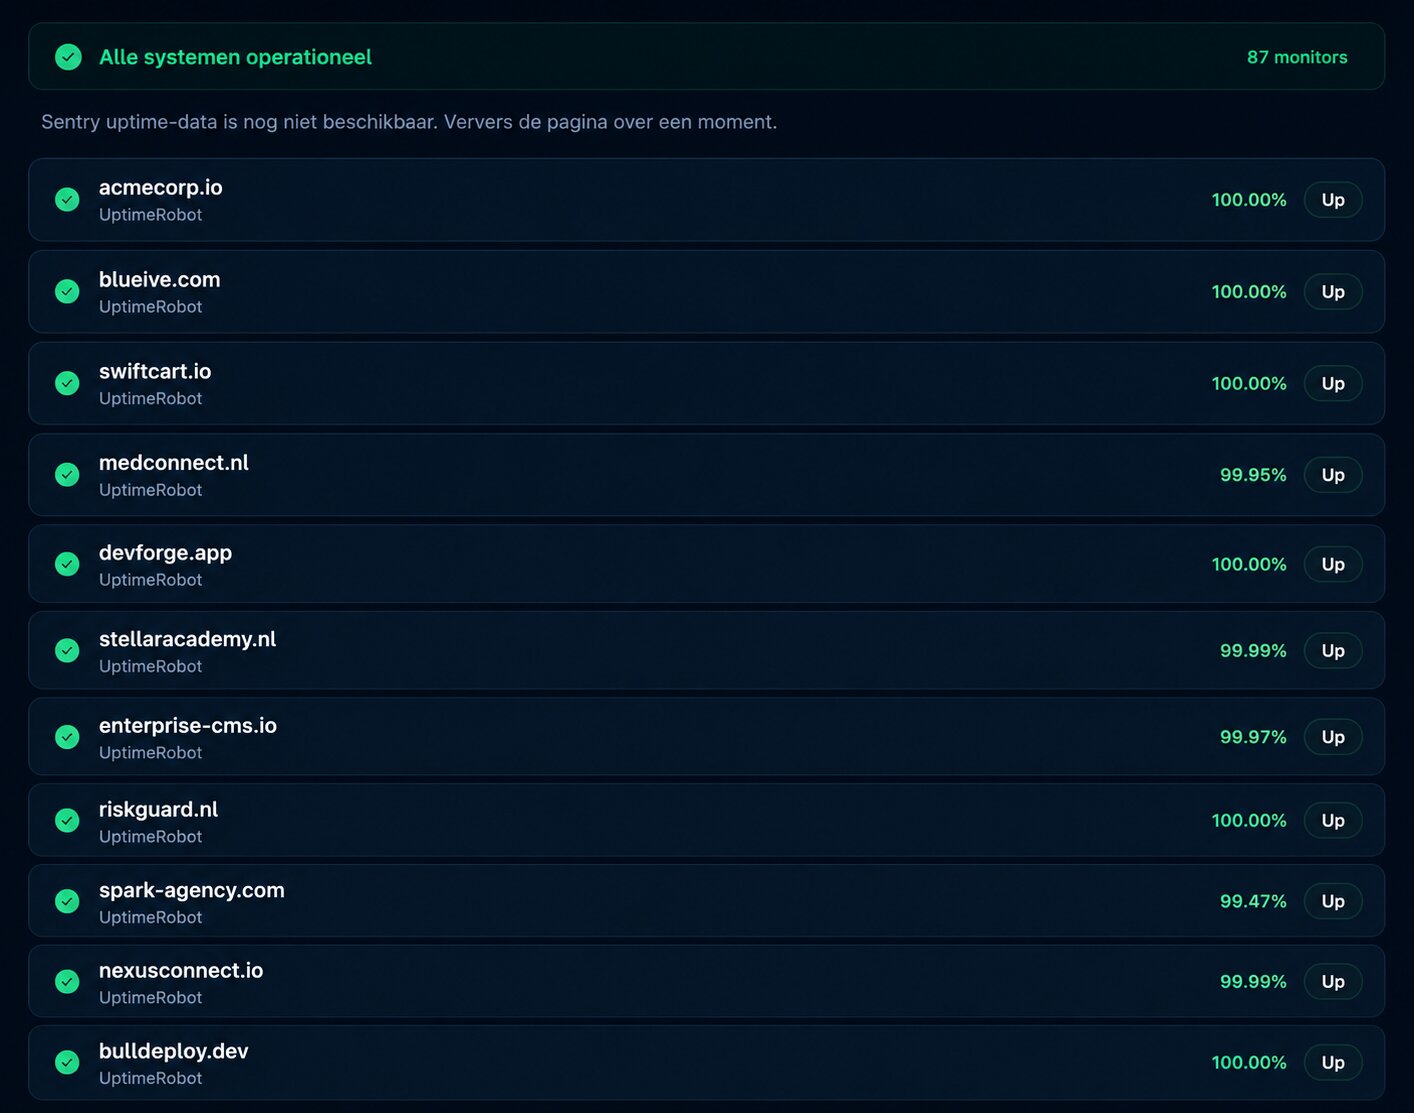
Uptime monitoring dashboard

See trends, not just snapshots

Response time history shows you how your endpoints perform over time — not just right now. Spot degradation before it becomes downtime and investigate spikes with full context.

  • Response time tracked per check interval
  • Visual chart with daily and weekly views
  • Warning thresholds with colour-coded indicators
  • Slowdown detection before full outages
Uptime response time history

A complete record of every outage

Every downtime event is logged with the affected endpoint, duration, and recovery time. When a client asks what happened on a specific date, the answer is already there.

  • Start and end time for every incident
  • Duration and endpoint logged automatically
  • Recovery notifications as well as down alerts
  • Historical log searchable by endpoint or date
Uptime incident log

Always-on monitoring, built in

HTTP endpoint monitoring
Monitor any URL with configurable check intervals. Detect 4xx and 5xx responses as downtime events.
Server monitoring
Track server availability alongside your web endpoints so you know whether the app or the host is the problem.
Instant notifications
Get alerted the moment a monitor goes down. Receive a recovery notification when it comes back up.
Uptime percentages
Rolling uptime percentage per monitor over 30, 60, and 90 days. Report to clients with confidence.
Response time history
Track response times over days and weeks. Catch degradation trends before they become full outages.
Incident log
A permanent record of every downtime event with start time, end time, and duration. Never lose an incident report again.

Never be the last to know

Monitor every endpoint and server in one place, without leaving your workspace.

Sign in to your workspace